
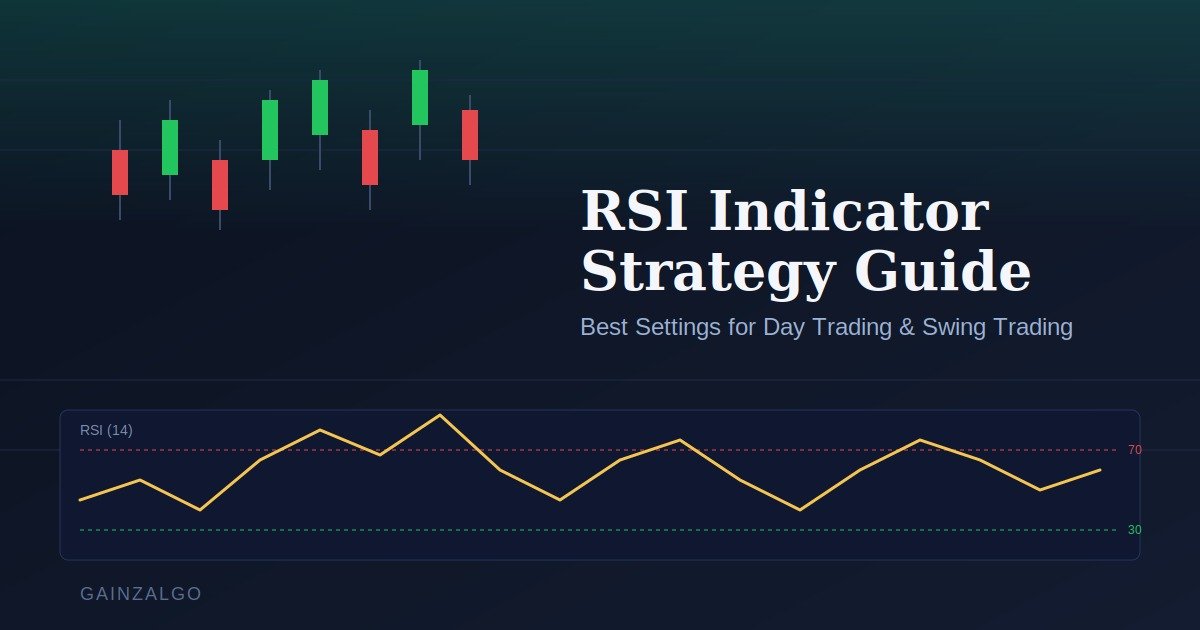
RSI Indicator Strategy Guide: Best Settings for Day Trading and Swing Trading
Every trader eventually runs into the same oscillator on almost every chart. It sits below the price, moves between 0 and 100, and gets credit for calling tops and bottoms with surprising consistency. That oscillator is the RSI indicator, and it remains one of the most widely used tools in technical analysis, decades after it was first introduced.
This guide breaks down what the RSI indicator actually measures, how it works under the hood, and which settings tend to fit day trading versus swing trading. Along the way, we will look at practical ways of using RSI in trading so the numbers on your screen turn into decisions you can actually act on.
What Is the RSI Indicator?
The RSI indicator, short for Relative Strength Index, is a momentum oscillator developed by J. Welles Wilder in 1978. It measures the speed and magnitude of recent price changes to evaluate whether an asset is overbought or oversold.
Unlike trend-following tools such as moving averages, the RSI indicator does not tell you where price is going next. Instead, it tells you how strong or weak the current move has been compared to recent history. That distinction matters, because it changes how the indicator should be interpreted.
The RSI indicator is plotted on a scale from 0 to 100. Traditionally, a reading above 70 suggests an asset may be overbought, while a reading below 30 suggests it may be oversold. However, these thresholds are starting points, not fixed rules, and they shift depending on the asset, the timeframe, and the surrounding trend.
Because it is bounded and easy to read, the RSI indicator has become a staple across stocks, forex, crypto, and futures markets. Traders use it alone or alongside other tools to confirm entries, spot reversals, and gauge exhaustion in a trend.
How the RSI Indicator Works
To understand how the RSI indicator works, it helps to look at the calculation itself, even briefly. The formula compares the average gain to the average loss over a set number of periods, typically 14.
The basic formula looks like this:
RSI = 100 − [100 / (1 + RS)]
Here, RS stands for the average of upward price changes divided by the average of downward price changes over the chosen lookback period. When gains dominate losses, RS rises, and the RSI indicator climbs toward 100. When losses dominate, RS falls, and the indicator moves toward 0.
This calculation is smoothed, which means the RSI indicator does not simply react to the last candle. It reflects a rolling average of recent momentum, which is why the line moves in a relatively fluid curve rather than jumping erratically.
Because the relative strength index is derived from price alone, it works as a leading tool during ranges and a lagging one during strong trends. In sideways markets, it often signals turning points early. In powerful trends, it can stay in overbought or oversold territory for long stretches, which trips up traders who treat every extreme reading as an automatic reversal signal.
Understanding this behavior is the foundation for using RSI in trading effectively. The indicator is not wrong when it stays overbought during a rally. It is simply reflecting sustained buying pressure, and price context needs to guide how that reading gets interpreted.
Best RSI Settings for Day Trading
Day traders operate on compressed timeframes, so the standard 14-period RSI indicator can feel sluggish. Many intraday traders shorten the lookback period to react faster to price swings.
A 9-period or even 7-period RSI indicator is common on 1-minute, 5-minute, and 15-minute charts. Shorter periods make the line more sensitive, which produces more signals but also more noise. This trade-off means day traders usually pair the RSI indicator with tighter risk management and clear invalidation points.
Some practical adjustments day traders make include:
- Using a 9-period setting on 5-minute or 15-minute charts for faster signal generation.
- Widening the overbought and oversold bands to 80 and 20 instead of 70 and 30, since shorter periods spike more often.
- Watching for quick reversals from extreme readings rather than waiting for a full trend change.
- Combining the RSI indicator with volume or price action at key support and resistance levels, since momentum alone rarely justifies a trade on short timeframes.
Because intraday price action is noisy, relying on the RSI indicator in isolation tends to produce false signals. It works best as a filter that confirms a setup already visible on the price chart, rather than as a standalone trigger.
Best RSI Settings for Swing Trading
Swing traders hold positions for several days to a few weeks, so they generally benefit from the default 14-period RSI indicator, calculated on daily or 4-hour charts. This period was Wilder's original recommendation, and it remains well suited to filtering out short-term noise while still responding to meaningful shifts in momentum.
On higher timeframes, the traditional 70 and 30 levels tend to hold up better than they do intraday. A daily RSI indicator crossing above 70 often coincides with genuine exhaustion in a swing move, while a drop below 30 frequently lines up with a tradable bounce, especially in range-bound markets.
Swing traders often layer in these approaches:
- Watching for the RSI indicator to cross back below 70 after an overbought reading, rather than selling the moment it touches 70.
- Looking for bullish or bearish divergence between price and the relative strength index across several daily candles.
- Using the 50 level as a trend filter, treating readings above 50 as bullish bias and below 50 as bearish bias.
- Adjusting the period slightly, to 10 or 21, depending on how the asset has behaved historically.
Because swing trades unfold over days, patience matters more here than speed. A slightly slower RSI setting reduces whipsaws and gives each signal more room to develop before a decision needs to be made.
Using RSI in Trading: Core Strategies
Beyond simply reading overbought and oversold levels, there are several established methods for using RSI in trading that experienced traders lean on.
Overbought and oversold reversals. The most basic approach treats extreme readings as potential turning points. This works best in ranging markets and should be avoided as a standalone signal during strong trends.
Divergence. When price makes a new high but the RSI indicator makes a lower high, that is bearish divergence, hinting that upward momentum is fading even though price is still climbing. The reverse pattern, a lower price low paired with a higher RSI low, signals bullish divergence. Divergence tends to be one of the more reliable applications of the relative strength index, though it works better as a warning sign than a precise entry trigger.
Centerline crossovers. Rather than focusing on 70 and 30, some traders watch the 50 level. A move above 50 suggests momentum has shifted bullish, while a drop below 50 suggests bearish control. This method fits trend-following styles better than pure reversal trading.
Failure swings. Wilder himself described this pattern, where the RSI indicator fails to reach a new extreme before reversing, even though price continues briefly in the same direction. A failure swing can signal an early shift in momentum before it shows up clearly on the price chart.
Combining RSI with trend tools. Pairing the RSI indicator with a moving average or trendline filter helps separate genuine reversal signals from routine pullbacks inside a strong trend. For example, only acting on oversold readings when price sits above a rising 200-day moving average filters out many false bottoms during downtrends.
Common Mistakes to Avoid
Even experienced traders misuse the RSI indicator in predictable ways. Recognizing these patterns helps avoid costly errors.
Treating every overbought reading as a sell signal is one of the most frequent mistakes. During strong trends, the relative strength index can remain overbought for extended periods while price keeps climbing. Selling too early in that scenario often means exiting a winning trend prematurely.
Ignoring the broader market context is another common issue. The RSI indicator reflects momentum, not fundamentals or structure. A reading of 25 on a stock inside a confirmed downtrend carries different implications than the same reading on a stock inside a healthy uptrend.
Using a single timeframe in isolation can also mislead. Checking the RSI indicator on both a higher timeframe and the trading timeframe tends to produce more consistent results, since it aligns short-term signals with the broader trend.
Finally, many traders forget that settings should be tested against the specific asset and timeframe being traded. A period and threshold that works well for a large-cap stock may not transfer cleanly to a volatile cryptocurrency pair.
RSI vs Other Momentum Indicators
The RSI indicator is often compared to the MACD, stochastic oscillator, and other momentum tools. While each has its own calculation, the relative strength index tends to be smoother than the stochastic oscillator, which makes it less prone to whipsaws but slightly slower to react. Compared to MACD, RSI is bounded between 0 and 100, which makes overbought and oversold readings easier to standardize across different assets.
No single indicator captures everything a chart offers. Most experienced traders treat the RSI indicator as one input among several, rather than a complete trading system on its own.
Final Thoughts
The RSI indicator has stayed relevant for decades because it captures something simple and useful: whether recent momentum has stretched further than it can comfortably sustain. Day traders benefit from faster settings and wider bands, while swing traders generally do better sticking closer to the original 14-period design on higher timeframes.
Used carefully, and combined with trend context, support and resistance, or a second confirming tool, the relative strength index becomes far more than a textbook overbought and oversold gauge. It becomes a practical way to read the rhythm of a market before committing capital to a trade.
For traders who want to study RSI signals alongside broader trend and momentum data in one place, GainzAlgo's tools are built to help bring that kind of multi-factor analysis together on a single chart.









0 Comments