
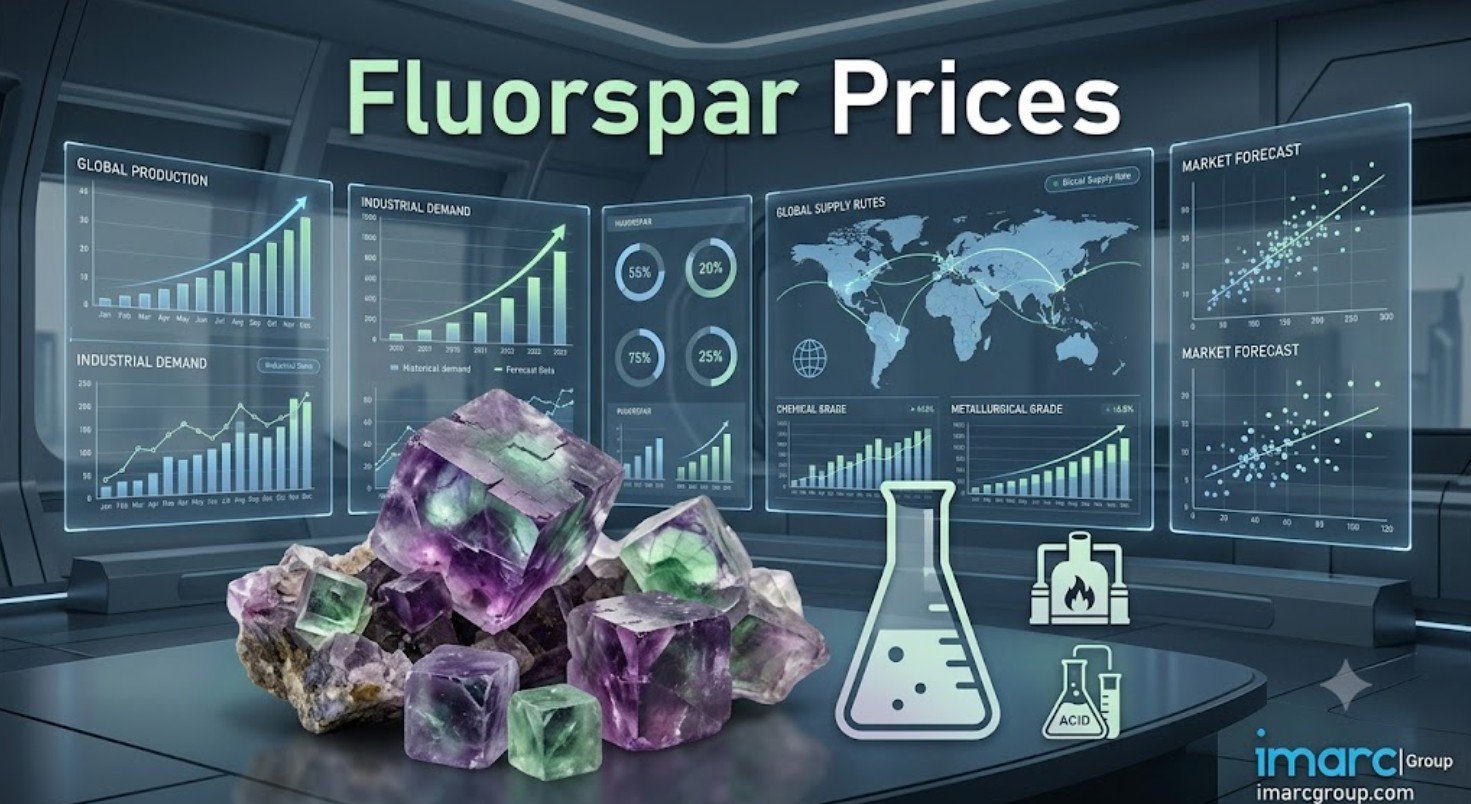
Fluorspar Price Index, Trend Chart & Quarterly Forecast – Explore the Latest Price Charts
The Fluorspar Prices Index recorded a strong upward trajectory across major global markets in Q2 2026, supported by constrained high-grade ore availability, firming downstream hydrofluoric acid (HF) and aluminum fluoride demand, and elevated mining production costs. Insights derived from the Fluorspar Historical Price Chart published by IMARC Group indicate that environmental compliance audits across primary extraction basins alongside sustained consumption in fluorochemical, lithium-ion battery, and metallurgical flux industries generated consistent upward pricing momentum across regional trade hubs.
Demand remained particularly resilient across acid-grade fluorspar ( ) for fluoropolymer and refrigerant synthesis, as well as metallurgical-grade fluorspar for steelmaking and aluminum smelting flux applications. Procurement managers in major importing regions maintained disciplined forward contracting to safeguard high-quality volume allocations amidst tight spot market availability. Overall, Q2 2026 reflected a seller-favorable market landscape governed by regional mining yields, environmental extraction quotas, and transatlantic and trans-pacific ocean freight surcharges.
Regional Prices Outlook – Q2 2026: Where Are Prices Highest?
- Canada: USD 633/MT
- Japan: USD 602/MT
- Brazil: USD 589/MT
- USA: USD 550/MT
- South Korea: USD 460/MT
The regional price spread illustrates notable cost disparities governed by import dependency, quality grade specifications, and regional shipping logistics. Canada recorded the highest market price globally at USD 633/MT, driven by strict quality compliance standards for high-purity chemical processing, elevated inland transport overheads, and firm domestic consumption. Japan followed as the second-highest market at USD 602/MT, supported by heavy reliance on sea-borne imports and active off-take from advanced fluorochemical, semiconductor, and precision electronics fabricators.
Brazil registered pricing at USD 589/MT, backed by improved demand from regional chemical processing industries, controlled domestic availability, and firm supplier quotes. The United States recorded prices at USD 550/MT, reflecting tight availability of high-quality acid-grade material, firm hydrofluoric acid demand, and elevated production costs. South Korea positioned at USD 460/MT, where proximity to Asian mining hubs provided a lower baseline price structure despite steady industrial and chemical demand.
Regional Price Analysis of Fluorspar Prices – Q2 2026
Canada
Canada reported fluorspar prices at USD 633/MT in Q2 2026. Elevated import handling fees, stringent technical specifications for acid-grade applications, and high logistics expenses across regional distribution networks supported firm supplier quotes throughout the quarter. Downstream chemical processors engaged in forward buying to secure required volume allocations.
Japan
Japan registered fluorspar pricing at USD 602/MT during Q2 2026. Active procurement across precision electronics, fluoropolymer manufacturing, and specialty chemical synthesis sectors sustained strong volume off-take. Reliance on long-distance ocean shipping lines and tight global spot ore availability maintained well-supported import offers.
Brazil
Brazil recorded prices at USD 589/MT. Market conditions observed upward price movement due to improved consumption from domestic chemical processing plants and steel foundries. Controlled domestic supply management practices and elevated transatlantic shipping tariffs further reinforced higher price baselines.
USA
The United States reported fluorspar prices at USD 550/MT in June 2026. Strong consumption from downstream fluorochemical, hydrofluoric acid, and aluminum-related applications provided direct upward support. Tighter availability of high-quality acid-grade material and elevated domestic processing expenses prompted suppliers to maintain elevated pricing strategies.
South Korea
South Korea stood at USD 460/MT in Q2 2026. Stable demand from regional chemical manufacturing, electronics, and industrial sectors supported steady procurement activity. Controlled availability from Asian mining origins maintained firm buying conditions throughout the quarter.
Supply and Demand Overview – Q2 2026
Global supply conditions for fluorspar remained constrained throughout Q2 2026 as primary mining districts operated under environmental compliance guidelines, extraction quotas, and controlled mine dispatches. Limited spot availability of high-purity acid-grade ore restricted uncontracted allocations across international trade routes.
Demand dynamics demonstrated sustained strength across primary downstream sectors:
- Hydrofluoric Acid (HF) & Fluorochemicals: High, non-discretionary volume demand for refrigerant gases and fluoropolymers
- Lithium-Ion Battery Electrolytes (
 ): Robust intake driven by global energy storage and electric vehicle expansion
 - Aluminum Smelting Flux (
 ): Steady baseline demand for primary aluminum reduction cells
 - Steelmaking & Metallurgical Refineries: Consistent demand for slag fluidity and desulfurization
Global dry bulk shipping channels operated under elevated freight tariffs and insurance premiums, maintaining distinct price spreads between exporting mining basins and import-dependent refining hubs.
Key Factors Affecting Prices – Quarterly Perspective
Several critical drivers influenced fluorspar pricing during Q2 2026:
- Mining Quotas & Environmental Regulations: Enforced environmental compliance audits and extraction limits in key mining regions restricted ore availability.
- Fluorochemical & HF Plant Run Rates: Throughput levels at global hydrofluoric acid facilities directly dictated raw acid-grade fluorspar consumption.
- Mining & Beneficiation Expenses: Elevated fuel, explosive, and processing utility expenses maintained high operational floor prices for mine operators.
- Energy Transition Demand: Accelerated production of battery electrolytes () and solar-grade PVDF expanded high-purity feedstock requirements.
- Ocean Freight & Insurance Tariffs: Elevated Pacific and Atlantic shipping rates added cost buffers to landed CIF/CFR quotes.
Recent Developments (Q2 Highlights)
- Enforced environmental quotas and inspection cycles across primary Asian and Latin American mining hubs restricting spot ore output
- Increased long-term forward contracting by fluorochemical manufacturers seeking to cushion against high-grade ore deficits
- Expanded procurement of acid-grade fluorspar for high-density lithium-battery electrolyte () synthesis
- Strategic inventory replenishment by Western industrial buyers taking advantage of predictable quarterly contract offers
For detailed insights, charts, and forecasts, explore: https://www.imarcgroup.com/fluorspar-pricing-report/requestsample
Fluorspar Price Chart Analysis – Monthly Movement
The Fluorspar Price Chart for Q2 2026 illustrates a steady upward progression across all primary consuming and importing regions.
Key quarterly movements include:
- April: Initial price firming as downstream HF and fluorochemical manufacturers refilled second-quarter contract volumes.
- May: Upward momentum consolidated across North American and European trade hubs supported by tight high-grade ore availability.
- June: Spot offers settled at elevated baselines across global markets as supply conditions remained firm and mine output stayed controlled.
This predictable upward trajectory enabled strategic procurement teams to evaluate optimal purchasing windows, assess purity-grade price spreads, and manage inventory risks effectively.
Fluorspar Price Index & Historical Analysis
The Fluorspar Price Index moved higher in Q2 2026 relative to Q1 2026, signaling a supply-constrained market environment backed by steady high-tech industrial consumption. According to IMARC Group’s price-tracking database, the index highlights persistent price strength fueled by disciplined upstream mining output and active chemical sector intake.
Historical analysis indicates that fluorspar prices experienced periodic fluctuations throughout 2025 due to shifting industrial manufacturing build rates, volatile freight logistics, and changing environmental mining regulations. Entering mid-2026, firming demand from fluoropolymers, clean energy storage, and semiconductor chemical manufacturing stabilized the upward pricing trajectory.
The historical trend reflects cyclical movements linked to:
- Primary mine production quotas and environmental compliance enforcement
- Hydrofluoric acid (HF) and fluoropolymer manufacturing cycles
- Global primary aluminum smelting and steelmaking output cycles
Compared to previous quarters, Q2 2026 established a firmer pricing baseline with reduced spot market fluctuations across major global trade zones.
What Is Fluorspar?
Fluorspar (also known as fluorite,  ) is a naturally occurring halide mineral composed of calcium fluoride. It is commercialized in two primary commercial grades: Acid-grade fluorspar (minimum
  ), used for chemical synthesis, and Metallurgical-grade fluorspar (
 ), used as a fluxing agent in metal refining.
Key applications include:
- Primary raw material for Hydrofluoric Acid (HF), the precursor for refrigerants, fluoropolymers (PTFE/PVDF), and specialty fluorochemicals
- Essential chemical building block for Lithium Hexafluorophosphate () battery electrolytes used in electric vehicles
- Fluxing agent in Steelmaking and Primary Aluminum smelting () to lower melting temperatures and remove impurities
- Manufacturing of opalescent glass, ceramic enamels, and fiberglass insulation
Its irreplaceable role in fluorine chemistry makes it a vital strategic mineral across advanced energy storage, electronics, chemical processing, and metallurgical manufacturing.
Fluorspar Price Forecast – Next 12 Months
The fluorspar price forecast indicates a firm-to-stable market outlook over the next 12 months, supported by structural supply limits, expanding battery electrolyte demand, and steady fluorochemical manufacturing requirements.
Key growth drivers include:
- Sustained expansion in global electric vehicle battery manufacturing driving high-purity HF and consumption
- Growing adoption of high-performance fluoropolymers in 5G infrastructure, semiconductors, and green hydrogen membranes
- Continuous demand for aluminum fluoride and fluxing agents in global metal production
Potential risks include:
- Macroeconomic slowdowns impacting broader automotive production and construction coatings
- Unplanned supply releases or regulatory shifts in primary mining jurisdictions altering spot ore availability
- Technological advances reducing fluorine loading in low-tier chemical applications
Overall, prices are expected to maintain an elevated baseline with moderate fluctuations driven by seasonal mining yields and ocean freight trends.
FAQs About Fluorspar Prices Insights & Market Analysis
What does the Fluorspar Price Index indicate in Q2 2026?
It highlights a steady price increase across major global markets, led by Canada (USD 633/MT) and Japan (USD 602/MT), driven by tight acid-grade ore availability, environmental mining quotas, and firm fluorochemical demand.
How does the Fluorspar Price Chart assist procurement decisions?
The chart provides clear visibility into quarterly price movements, helping procurement managers track purity-grade price spreads, assess ocean freight impacts, and optimize contract renewal timing.
What is the fluorspar price forecast for the next 12 months?
Prices are projected to remain firm and stable, backed by sustained consumption in hydrofluoric acid, battery electrolytes, fluoropolymers, and aluminum smelting flux.
How IMARC Pricing Database Can Help
The latest IMARC Group study, "Fluorspar Prices, Trend, Chart, Demand, Market Analysis, News, Historical and Forecast Data 2026 Edition," presents a detailed analysis of Fluorspar price trend, offering key insights into global Fluorspar market dynamics. This report includes comprehensive price charts, which trace historical data and highlights major shifts in the market.
The analysis delves into the factors driving these trends, including raw material costs, production fluctuations, and geopolitical influences. Moreover, the report examines Fluorspar demand, illustrating how consumer behavior and industrial needs affect overall market dynamics. By exploring the intricate relationship between supply and demand, the prices report uncovers critical factors influencing current and future prices.
About Us:
IMARC Group is a global management consulting firm that provides a comprehensive suite of services to support market entry and expansion efforts. The company offers detailed market assessments, feasibility studies, regulatory approvals and licensing support, and pricing analysis, including spot pricing and regional price trends. Its expertise spans demand-supply analysis alongside regional insights covering Asia-Pacific, Europe, North America, Latin America, and the Middle East and Africa. IMARC also specializes in competitive landscape evaluations, profiling key market players, and conducting research into market drivers, restraints, and opportunities. IMARC’s data-driven approach helps businesses navigate complex markets with precision and confidence.
Contact us:
IMARC Group
134 N 4th St. Brooklyn, NY 11249, USA
Email: sales@imarcgroup.com
Tel No: (D) +91 120 433 0800
United States: +1-201971-6302










0 Comments